
A crowd can be represented as a complex network of people. The people are represented by nodes which are connected to each other by relationships or edges. These edges have different kind of semantics associated with them. For example, the relationship can be that of “friends” or “follows” etc. Many different kinds of networks can be imagined using different semantic relationships. We already have Facebook which is a “friend” network, Twitter a “follow” network, Linkedin a “professional” network. Now there are new more specialized networks popping up like Doximity a network for doctors, Familyleaf is a networks for family, Anglelist is a network in the startup world, and many more. Spigit is a network for innovation in the same vein.
We have seen that networks are useful when they are active and engaged. There are multiple ways of measuring “engagement”. Metrics ranges from number of sign ins, number of page views, content submitted and many more. I propose that the number of messages sent between the nodes is a pretty good way to measure engagement among a crowd network.
An experiment
Consider a crowd of people, represented by a network 


Consider two random variables 


We first construct an ER graph in which the probability of a link existing between 


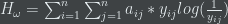
The entropies are combined into a single weighted variable say “crowd value” as follows,

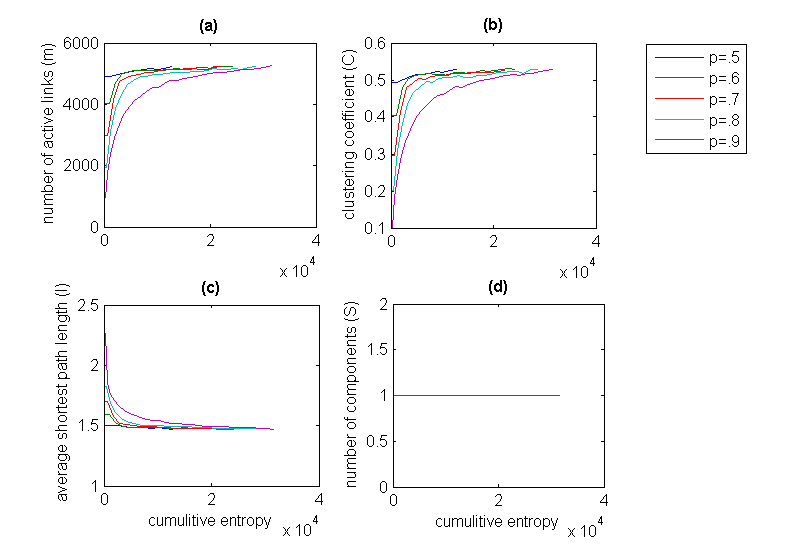
 . The link density probability (p) is varied from 0.5 to 0.9. For all values of p<0.5 , the parameters display more or less linear behavior. (a) The increase in the entropy is brought about by increase in the number of active links (m) in the network (b) shows as the number of links increases so does the clustering coefficient along with the network entropy, (c) shows the decrease in the average shortest path length along with the network entropy (d) shows number of disconnected components very quickly decreases to 1 forming a single giant component with increasing network entropy. In all cases after an initial sudden
increase/decrease the values quickly normalize to the theoretical limits.
To maximize the entropy of the graph we iteratively change the structure of the graph and compute the entropy for the resultant structure. If the entropy is higher than the previous stage the graph is accepted as a “better” version. At this point we compute some structural properties of the graph namely
1. number of links
2. clustering coeffcicient
3. average shortest path length
4. number of components in the graph
These metrics of graph are recorded after every iteration and their progress is charted along with the increasing communication entropy. The results can be seen in the figure. The whole process is repeated for different values of 
It can be clearly seen that a highly connected graph with low average shortest path length and high clustering are usually 
